
Things Are Great, Right? Measuring Progress

TLDR;
How do you effectively measure improvement in your organization's ability to deliver? Three metrics give you a comprehensive way to view the execution efficiency of your organization. Those metrics are as follows:
- Throughput - The number of working days it takes from the moment an engineer picks it up until it's in production. Viewed as a scatter plot with a Linear Regression trendline
- Risk - The Standard Deviation on week by week basis of throughput. This view gives insight into planning effectiveness and the team's ability to mitigate risk mitigation.
- Project Health - The number of stories in an Epic or Initiative, plotted over time.
These metrics won't tell you what is wrong, but they will notify you when something is off so that you can investigate and resolve the issues.
The Story
Once upon a time, I was doing a startup. I had the good fortune to again be working with one of the best engineers I know. In the interim between this new endeavor and the last time we worked together, a friend introduced him to an exciting approach to estimation. It boiled down to having the engineers who would work on a story provide a high and low estimation. On the low side, the engineer would estimate that they felt had about a five percent chance of being accurate. They would estimate what they felt would have a ninety-five percent chance of accuracy on the high side. For example, if you thought that a story might take five days, your five percent confidence estimate might be one day, while your ninety-five percent confidence rating might be ten days. We would then run a Monte Carlo simulation that predicted the completion date for a block of work. We simulated each member of the team, pulling a piece of work. We randomly chose a value between that engineer's low estimate and high estimate and simulated the engineer working on that work for that amount of time. We ran ten thousand simulations for each project. Of the simulation that resulted, we found that the seventieth percentile was the right number for the estimations. This approach is based on the book "How to Measure Anything: Finding the Value of Intangibles in Business".
Taking the human project level estimation out of the picture had an exciting effect. If the date projected was too far out to meet a business goal, we could remove or reduce work and rerun the simulation. That reality changed the conversation for all of us. It aligned us all and let us shift focus on the work and resources rather than whether the estimates were correct. It changed the conversation from 'Are you sure your estimates are correct?', 'Can't we still deliver in that time frame?', to one of 'Is that feature worth pushing the date out by X percent?', 'If we cut scope here and here, how does the date change?'.
Another big win was that we could track actual progress against expected progress. In our standups, we laid out our actual trendline over our projected trendline. If the real trendline was under the projected trendline, things were great. However, if the real trendline was over the projected trendline, we tried to figure out why. That tactical view on things that we should be looking at right now helped us execute much more effectively.
Losing the Tools
My next role was not a startup. It was a large, existing organization in a very tradition-bound industry. The organization was a heavy user of Jira, and they had a Program organization with a strong sense of ownership over the tooling. Any changes to the 'approved' process were challenging and time-consuming.
I had come from a place where the tooling supported the engineering efforts and served as an efficient and useful interface with the business. In my new role, the tooling was a dumping ground for Stories. Estimates were very high-level, usually provided by someone not tied to the project and were never correct. For a while, I was at a loss as to how to solve this problem.
Dealing With Constraints
I don't know what my teams were working on, I didn't know when they would finish, and I could not have useful conversations around trade-offs with my stakeholders. I was in a car with no brakes headed downhill towards a set of curves. Things never ended well.

I spent a lot of time iterating on this problem. After much experimentation, a few things occurred to me.
- Stories should take about five working days, give or take.
- If stories take approximately five working days, then variations come out in the wash, statistically speaking.
I can work with the teams to create stories that try to stay under that five-day mark and then watch the throughput to gauge efficiency, without any changes to the existing tooling or processes, beyond a hard push for small stories.
Measuring Throughput
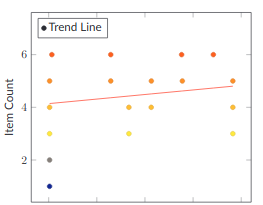
I went through a lot of iterations, but in the end, I figured out that a scatter plot with a Linear Regression trendline was the best way to look at this data. We ended up with a chart that looks like this.
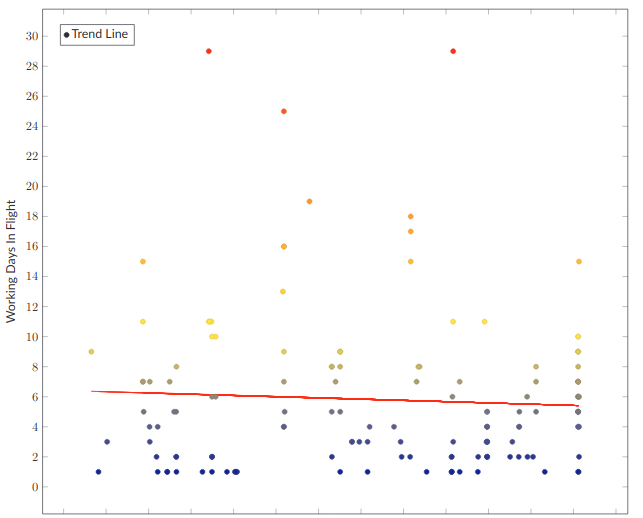
This chart shows the total number of working days to go from the engineer starting the work to the item being in production for each Story delivered to production as a point on the graph. The red line is the linear regression-based trendline. This view shows a nice cluster of work delivered around where I would expect it. Mostly between two and eight days, but it has some nasty outliers. Large items in a queue that individually have high latency cause things around them to have high latency. In this view, those nasty outliers are immediately visible and actionable.
Actionable Information
I think of these metrics as two sides of the same coin. One side is using metrics to measure how the organization is doing. The second is finding 'actionable things that you can do right now' to affect those metrics. That's where the active companion to this graph comes in. It's a simple list of Stories that are more than five working days old. This list gives you a list of potential problems that you should investigate. A few days one way or the other doesn't matter, but the longer or Story sits in development, the more critical it is that you address whatever is delaying it. Once it reaches a certain threshold, somewhere between five and ten days, you need to jump in and actively triage the problem.
The problem could be any number of things. Tactically, your goal is to get the Story moving. If the scope was too big, figure out how to shave down the current work into a coherent deliverable and create new stories for the remaining work to be picked up in the future. If the engineer needs help, get them the help that they need, etc.
Strategically, your goal is to solve the underlying problems that are causing those long delays. Do the people working on the stories not understand how the Story fits into the big picture? You may have a problem communicating the Strategy. Is the Story blocked, waiting on another team? You may have a Structure problem that you need to get worked out. The engineer doesn't deliver well? You may have a People problem. Is the story just not well written or well understood? You may have a Process problem. All of those problems are solvable, and now you have a mechanism to understand them and address them.
Measuring Planning Effectiveness and Risk Mitigation
The next important metric is the Standard Deviation in days in-flight on a week-by-week basis.
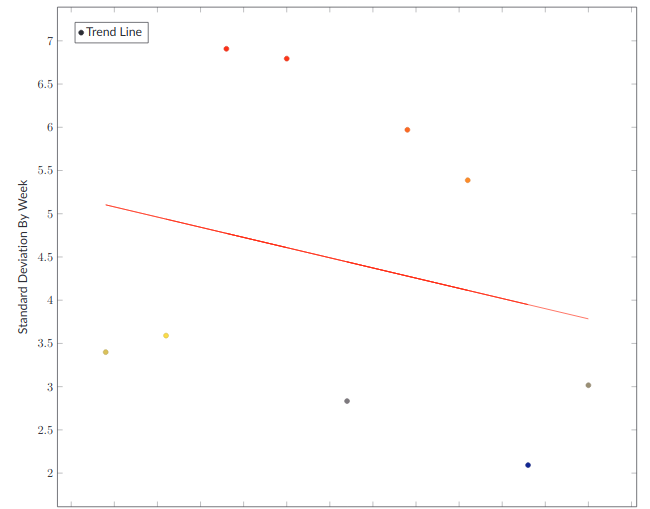
The higher the Standard Deviation, the worse you are doing in hitting that five-day target. A Standard Deviation of up to two isn't that bad. More than that is an indicator that something is wrong. Maybe your ability to razor your stories to the smallest reasonable deliverable is lacking. Your engineers may not know the codebase well. Your managers may be siloing the engineers, creating bottlenecks.
Regardless of the actual problems, once you see them, you can start to attack them. You can work with the team on setting individual tactical goals of resolving those Stories that have gone too long. You can look back at trends and help your managers address team-level issues while handling the Strategy and Structure issues that are causing problems.
Measuring Project Focus
What about the organization-level goals? Those projects that move the organization forward. Whether you call them Epics, Initiatives, or Projects, they are the same thing: High-level goals that take more than a few weeks to accomplish and provide significant value. For our discussion here, we will call them 'Projects.' Projects should take one to two months and require substantial sustained effort. Projects should plan them as a single unit. We have the same problem with Projects that we had with throughput. We can't touch the existing process, but we want to handle how our projects are doing.
This was another area of iteration and exploration. It took me an embarrassing amount of time to realize that the right thing to do was to look at the number of Stories assigned to a project over time. If Stories are designed to take about five days, then the addition or completion of Stories is significant. While it doesn't give me fine-grained insight into when the team will deliver a project, it does provide me with insight into how that delivery is going.
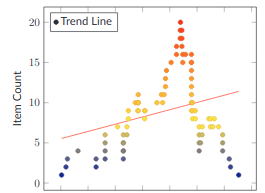
To gauge progress on a project, we look at the total number of stories over time. We are not looking at Story points, just the number of Stories. I should expect that the number of Stories rises sharply from zero at the beginning and then burns down over time. I expect it to look something like this.
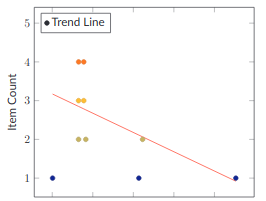
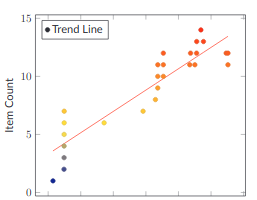
We add a few stories, and then over several weeks, we finish those stories. Some jitter in the burn-down phase is entirely acceptable. You can't know everything, and people make mistakes; as long as you see that nice downward trend in the linear regression, things are going well. Every once in a while, you see a perfect burn down that looks like this.
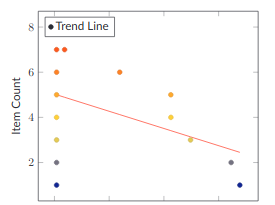
Aberrant Burndowns
When you look at your Project data this way, unhealthy projects jump out immediately. Quickly scroll down through this section and look at the various examples of unhealthy burndowns. I bet that you can guess what's going on with each one, without much effort.
That ability to see where your Projects are at a glance and see which ones are in trouble is a massive help in managing your organization and getting it focused on delivery.

You Are Not Focusing as Much as You Think You Are
I have found consistently that the organization is working on far more things than you think it is. Looking at the flow of work is the only way I have been able to uncover that effectively. The last metric is the number of projects you are working on at any one time. Organizations generally can work on one to three Projects per team. Any more than that, and you are trying to boil the ocean. In most organizations, the leaders think they have three or four projects in flight, usually twenty or thirty. I typically show that as a simple list of the number of Projects that are in flight and their percent complete. I define in-flight as the Project has at least one Story that has been worked on and still has Stories to be done. I ignore whatever status the Project has in the tooling. I am always surprised the first time I gather this data.
Future Work
I miss the ability to manipulate work and project new completion times. That functionality solved so many problems for me. I am exploring ways of accomplishing that without changing the tooling system in use (be it Jira, Mingle, etc.).
Finally
These metrics are ones I can gather simply from nearly any work management system, and they give me enough information to manage the organization effectively. I believe they will do the same for you.